Nooelec NESDR Exploration Intro
I recently got the device Nooelec NESDR that can receive Sensor Data Records (SDR)/radio signals. I was able to connect it to my Mac and installed the basic setup for SDR to run on my device. I enabled it to run on python and started installing the dump1090 software to detect flights in the nearby area based on the waves emitted. It was incredibly fascinating to see the different flights detected in the area near my house and to see their altitude, speed, Lat and Lon. The image below represents the table that it popped up in. The table was constantly printing, revealing updates and changes in the flight’s altitude as well as the speed and location that it was at. One of my next targets is to actually see whether I can take these latitude and longitude coordinates and be able to plot them on a base map that represents the location of the flights as well as in which direction they are going as they travel.
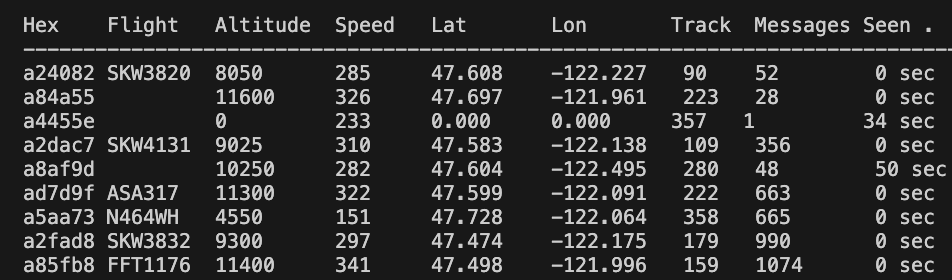
Flight Data Near my House
I was also curious about how the radio transmission works with this device and hence downloaded gqrx, the application that actually gave me the ability to hear the interception as I toggled with the frequencies. I tried multiple different frequencies and used the internet’s help to attain the frequencies that the radio was playing on. I also toggled the mode to be FM radio and suddenly, music and the radio started playing! It was so cool to see the different tunes and sounds change with the different frequencies. It felt like an absolute jackpot when I was finally able to hear music through a certain frequency.
A lot of my code took a lot of research and understanding to figure out because I had no idea where to begin and what to do, so I followed the instructions for this specific device about installations and then relied on internet tutorials and research to figure out the rest. Researching gave me more insight on the things that this device is capable of and want to explore them further as I go along.
One of my next steps is to actually map out the flight patterns using the matplotlib library or something similar (I have some experience because of my research project) and then plot the coordinates on a global base map. I also want to identify the NOAA satellites to gain imagery from them using my device because this device does support NOAA weather satellite frequencies and I’m interested in gaining imagery to see how I can utilize it. I was excited about NOAA specifically because environment and sustainability research using computer science is something I’m interested in and I would love to see the imagery and delve into that as a new experience!